Functions
What is a function?
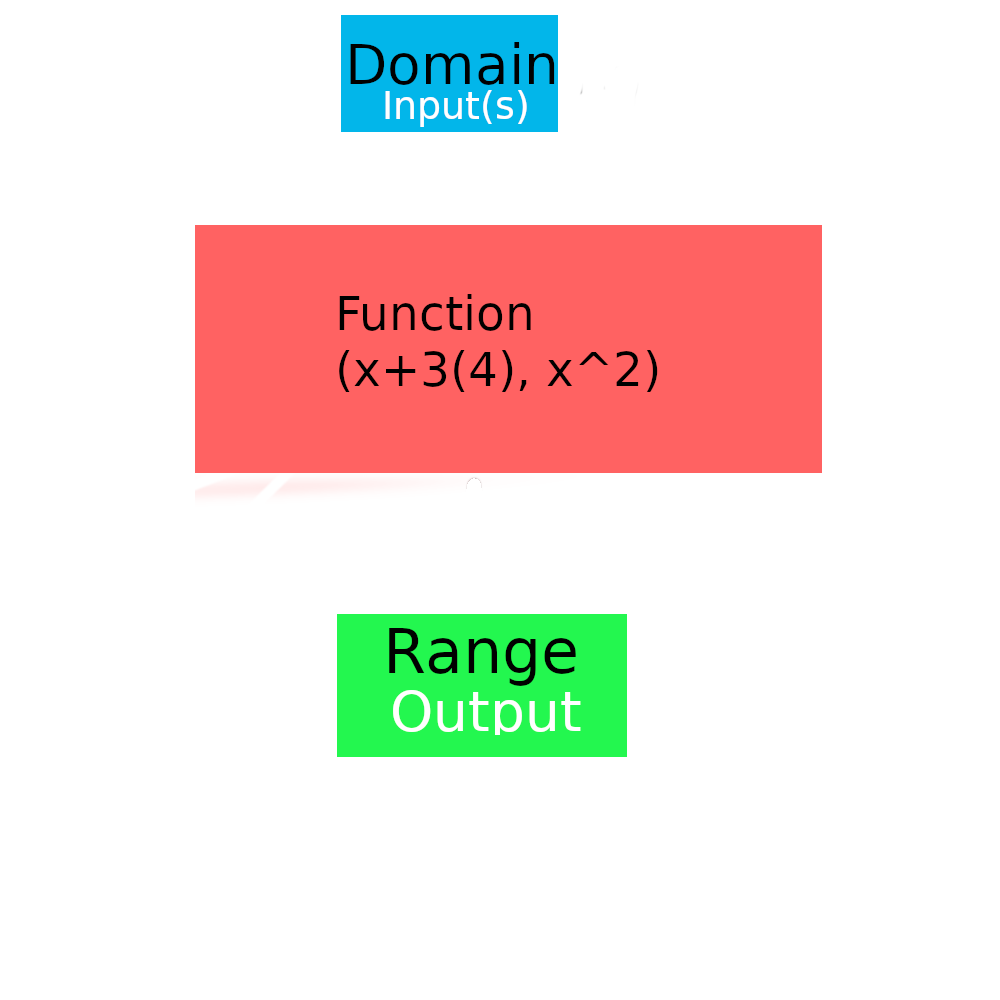
Well, a functions is, at its simplest form, is the relation between the domain(input(s) of the function) and range(output of the function). For it to be a function it is supposed to have only 1 output. The domain being a group of objects(set) like numbers that are input into the function and the range being the group of objects like numbers that are output of the function. The range is part of a bigger group of object which is the codomain.
Domain: input (typically x)
Range: output (typically y or f(x))
Codomain: Group (or set) of objects that the range is a part of
For something to be a function, one domain element(object) should relate to one range element(object).

A function can be show using function notation, for example:
read as "f of x equals x squared plus 1"
How do we represent the relation between domain and range?
There are 4 ways to represent this relation which are
How to identify if a graph is a function?
You can use Vertical Line Test (VLT) to see if its a function or not. If it intersects the graph only once, it is a function. If it intersects the graph more than once, then its not a function.
For example:
In this graph, the vertical line only intersects the graph once so we can say it is a function.
While...
In this graph, the vertical line intersects more than once so it is not a function.
Mapping Diagram
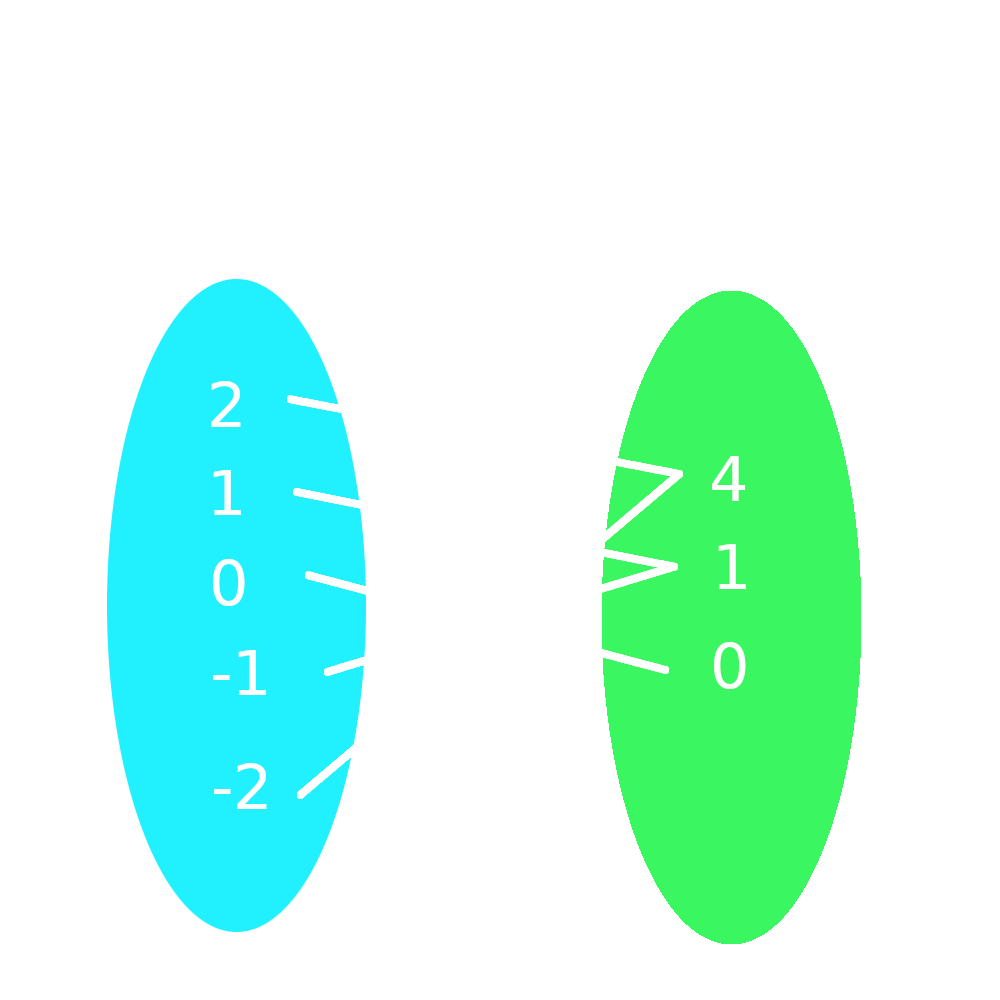
Mapping diagrams are done by listing out the domain in one oval and range in the other and connecting them with arrows to show their relation.

Graphing
Graphing is used to show the relation between domain and range and show how the function changes as the domain(x) as x → ∞ and/or x → -∞
As shown in the graph, we can observe that as x → ∞, f(x) → ∞, likewise x → -∞, f(x) → -∞
Table

Ordered Pairs
We can represent the relation of domain and range using a list of ordered pairs where ordered pairs are (x,y) or (domain,range). This list will be contained inside {}, for example:
Representing & Finding The Domain and Range
There are 2 main ways to represent the domain and range sets.
Set builder notaion
set builder notation is represented in the form of:
This is the Codomain
The conditions are usually inequalities like this:
Where the set is represented by these symbols:
Interval notation
Interval notations is a simplier, more concise way of representing inequalities but in the cost of it being assumed as part of the real set.
They are ususally in the forms of:
Where:
( & ) = a < x < b
[ & ] = a ≤ x ≤ b
So (a,b] = a < x ≤ b
When there is a hole in the graph, thy symbol "∪" is used to join 2+ individual intervals
Finding Domain and Range
Domain
To find the domain, one must find all the numbers which cannot be input into the function. For example:
Then you are able to remove this from the interval by splitting the interval into 2 and restricting it to remove 0. For example:
Types of Functions
One to One
When one domain element relates to only one range element.
Many to one
When many (2+) of the domain elements relate to one range element
Onto function
When all domain elements relate to elements of the codomain leading to the codomain set being equal to range set.
Into function
When at least one codomain set dosent relate to the domain set leading to the codomain set not being equal to the range set.
Invertible and non-invertible functions
An Invertible function is a function that has a unique output for every unique input, For example
While...
How to check if a graph is invertible?
Using a method called Horizontal Line Test(HLT). Like VLT, if the horizontal line passes the graph only once, it is invertible and if it passes more than once, it is non-invertible.
This is an example of an invertible function that passes the HLT
And this is an example of a non invertible function
How do you get the inverse of a function?
Firstly, you switch the places of the input variable and output variable
Then solve for y
So...
Odd and Even Functions
An odd function is a function where:
Examples are:
An even function is a function where:
Examples are: